Logs
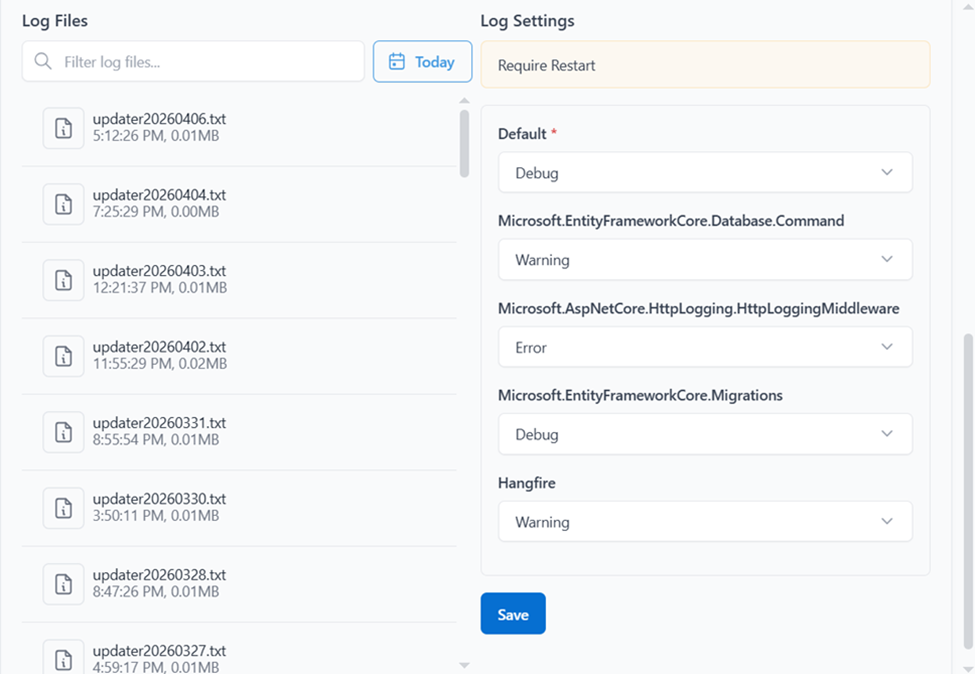
Datagate logs information from all subsystems of the platform: SQL Server, Hangfire (background tasks), web engine, authentication, reporting, document processing and others. All logs are written through a single mechanism — Serilog — which means a unitary format and a single place to search, regardless of the source of the event.
Classification
Each log entry is qualified on several dimensions:
Type (severity) — error, warning, information, debug. Allows quick filtering: An administrator investigating an issue looks at errors. A developer who diagnoses unexpected behavior goes down to the debug level.
Source — identifies the subsystem that generated the event. Example: PagesSearchIndexer, , CourierProcessing. SendEmailNotifications When a user reports a problem sending notifications, the administrator filters directly on the CourierProcessing source without going through thousands of irrelevant lines.
Operational context — event-specific information: ID of the processed document, verified AWB code, user who triggered the action. For example: Check AWB Status for DocumentID: 501, AWB: 1181874307. These details allow you to correlate a log with a specific operation in the system.
Analysis
Logs can be analyzed directly from Datagate's administration interface, without requiring access to the server or log files.
Admin Interface
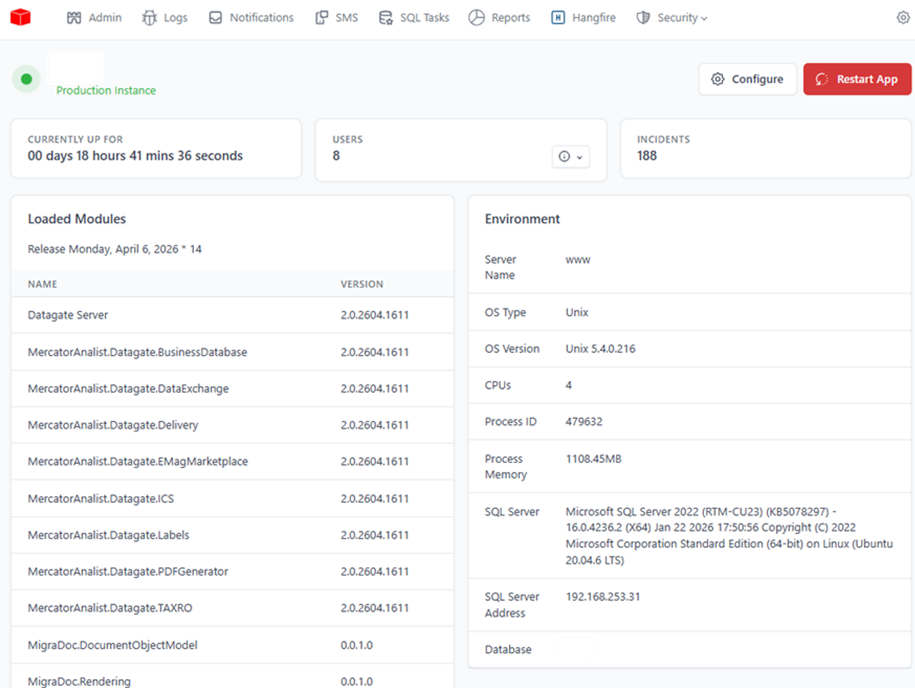
In addition to logs, the admin interface provides a complete picture of the environment in which Datagate runs — essential information for diagnostics and communication with the support team.
Execution environment
The administrator sees from a single page:
- Server — name, operating system type, OS version, number of available CPUs
- Process — Process ID, memory used by the application
- SQL Server — full version (including CU/patch level), server address, database name
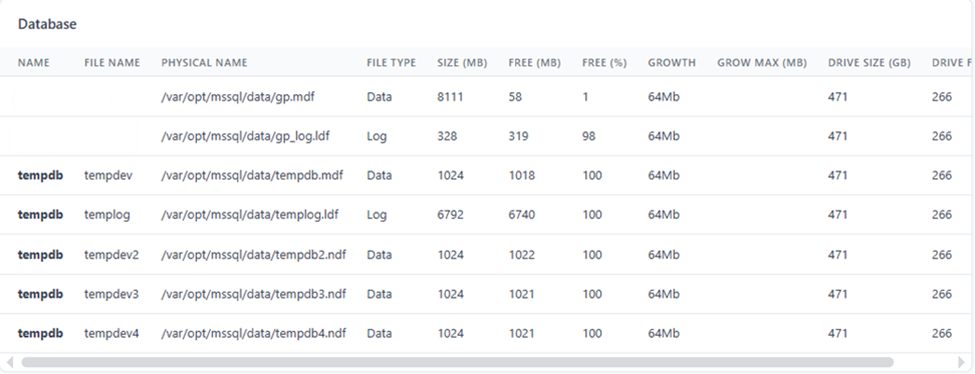
- Storage — the disk structure of database files and available space
This information is valuable in several situations: when reporting a bug to support (the exact version matters), when planning an upgrade (how much free disk space is left), or when investigating a performance issue (how many CPUs are available, how much RAM the application consumes).
Error and incident statistics
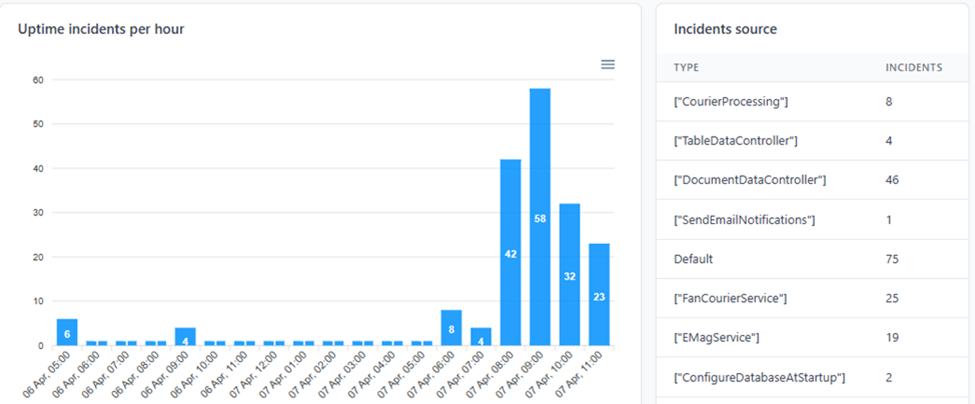
The interface presents aggregated statistics of errors and incidents by time periods. The goal is not to see each error separately (that's what logs are for), but to see the trend: are errors increasing? Have there been any new bugs since the last update? Is there a pattern — errors concentrated in a particular hour or day?
An upward trend in errors, even if the system appears to be operating normally, is a warning sign worth investigating before it becomes a visible problem for users.
Active users
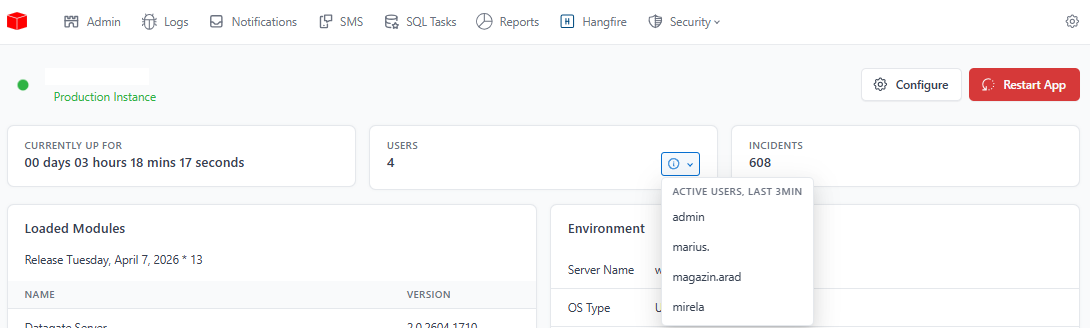
The page also displays the list of users who are currently active — who is logged in, when, from what location. Useful for checking the current load, identifying forgotten open sessions, or confirming that a user has access to the system when reporting a connectivity issue.